Global Temperature is Rising
Compilations of land and ocean annual average surface temperatures, averaged across the globe, show a steady increase.
The figure on the right shows average temperature change with zero taken as 1950. 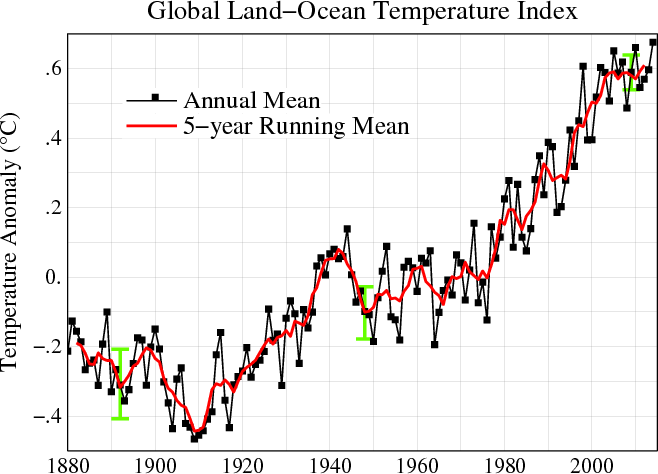 The figure is an update of a figure from Hansen et al., 2010.
Some argue that climate change is stalled, based on the flat 5-year running mean in the last decade. But as one can easily see, the overall trend is clearly up, and lately record annual highs are broken nearly every three years.
Another way to look at the data is a video compilation done by NASA (scroll down when you get to the link) and a compilation by Hansen et al., 2010 shown below.
Click on figure to enlarge.
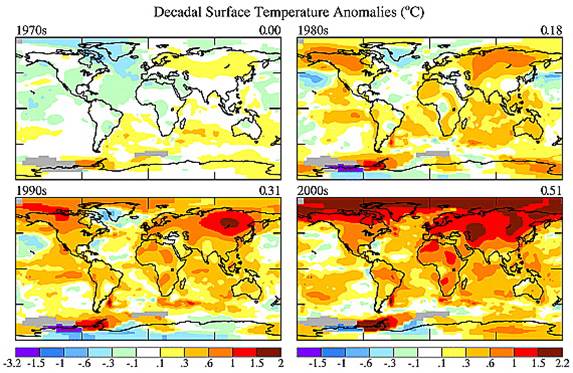
This figure shows the decadal surface temperature anomalies relative to a 1951–1980 base period.
Click on figure to enlarge.
Can We Trust the Data?
The data sets shown were compiled by NASA Goddard Institute for Space Studies (GISS). The temperature analysis scheme was first developed in the 1970s and documented in Hansen and Lebedeff, 1987. It is a rigorous method which has survived extensive peer review and scientific criticism. The changes we see are well beyond uncertainties in the data.
The data have also been tested by a group founded by physicist Dr. Richard A. Muller, leader of the Berkeley Earth Surface Temperature (BEST) project. A former climate skeptic and doubter of temperature data, Dr. Muller and his team at BEST have confirmed that temperature is rising, and that the NASA, NOAA and Hadley/CRU (Climate Research Unit) temperature data correspond well since 1950, as seen in the figure from the BEST website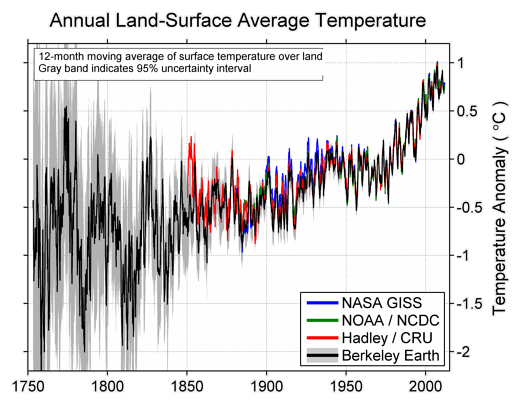 .
.
Click on figure to enlarge.