Greenhouse Gases and Temperature
Ice cores drilled from the thickest part of the eastern Antarctic ice sheet give us 800,000 years of data. Carbon dioxide (CO2) and methane (CH4) levels in the atmosphere at the time of freezing of the ice can be measured. Similarly the temperature at the time can be calculated. This gives us a plot of variation of temperature, methane, and carbon dioxide over time. 
Ice core data compiled from figures of Loulergue et al (p. 383) and Luthi et al (p. 379), Nature, 15 May 2008 are shown in the figure on the right.
Click on figure to enlarge.
Note that the present is on the left at zero time, and the deep past is on the right at 800,000 years before present. The estimated appearance of homo sapiens, at 200,000 to 300,000 years ago, is well within this time period.
From the figure one can see that the maximum temperature above the zero line (taken as 1950) is 4 degrees C, or about 7.4 degrees F. These temperature maxima correspond to CO2 maxima of about 300 ppm (parts per million) and CH4 maxima of about 800 ppb (parts per billion).
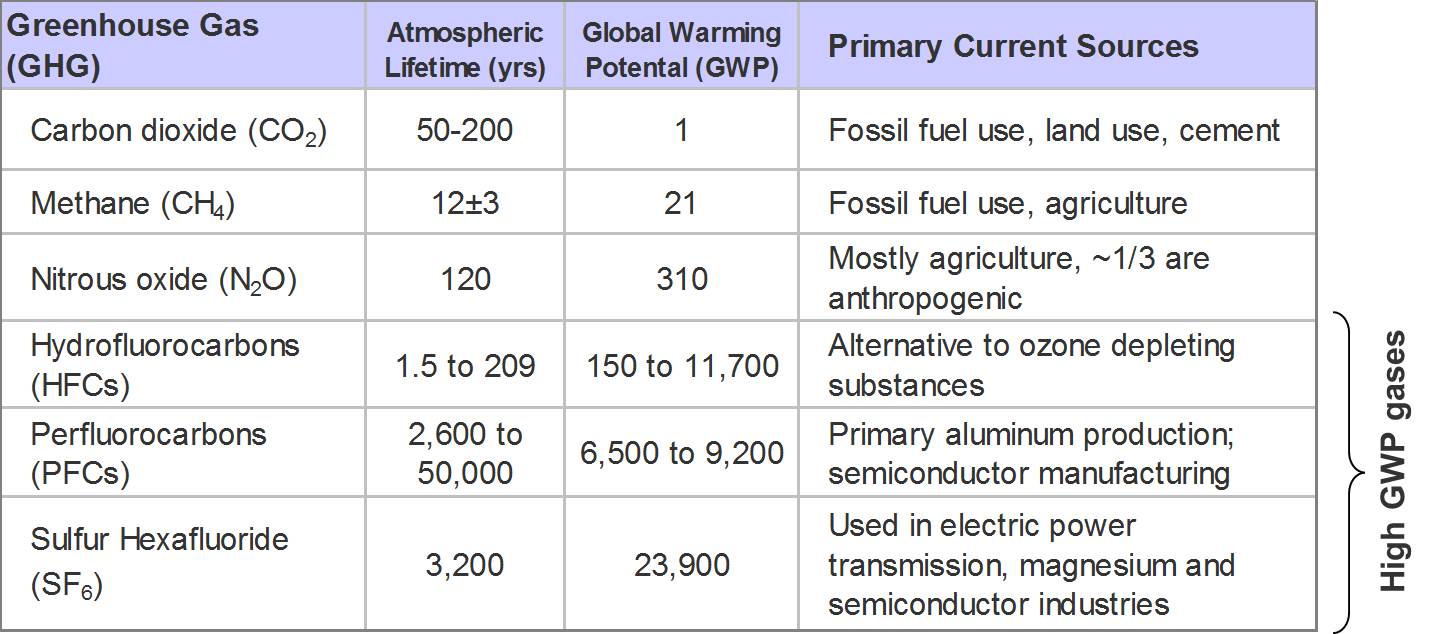
Today, measured concentrations of CO2 in the atmosphere are about 400 ppm, and methane is over 1800 ppb. These values are literally off the chart of the figure on the right. 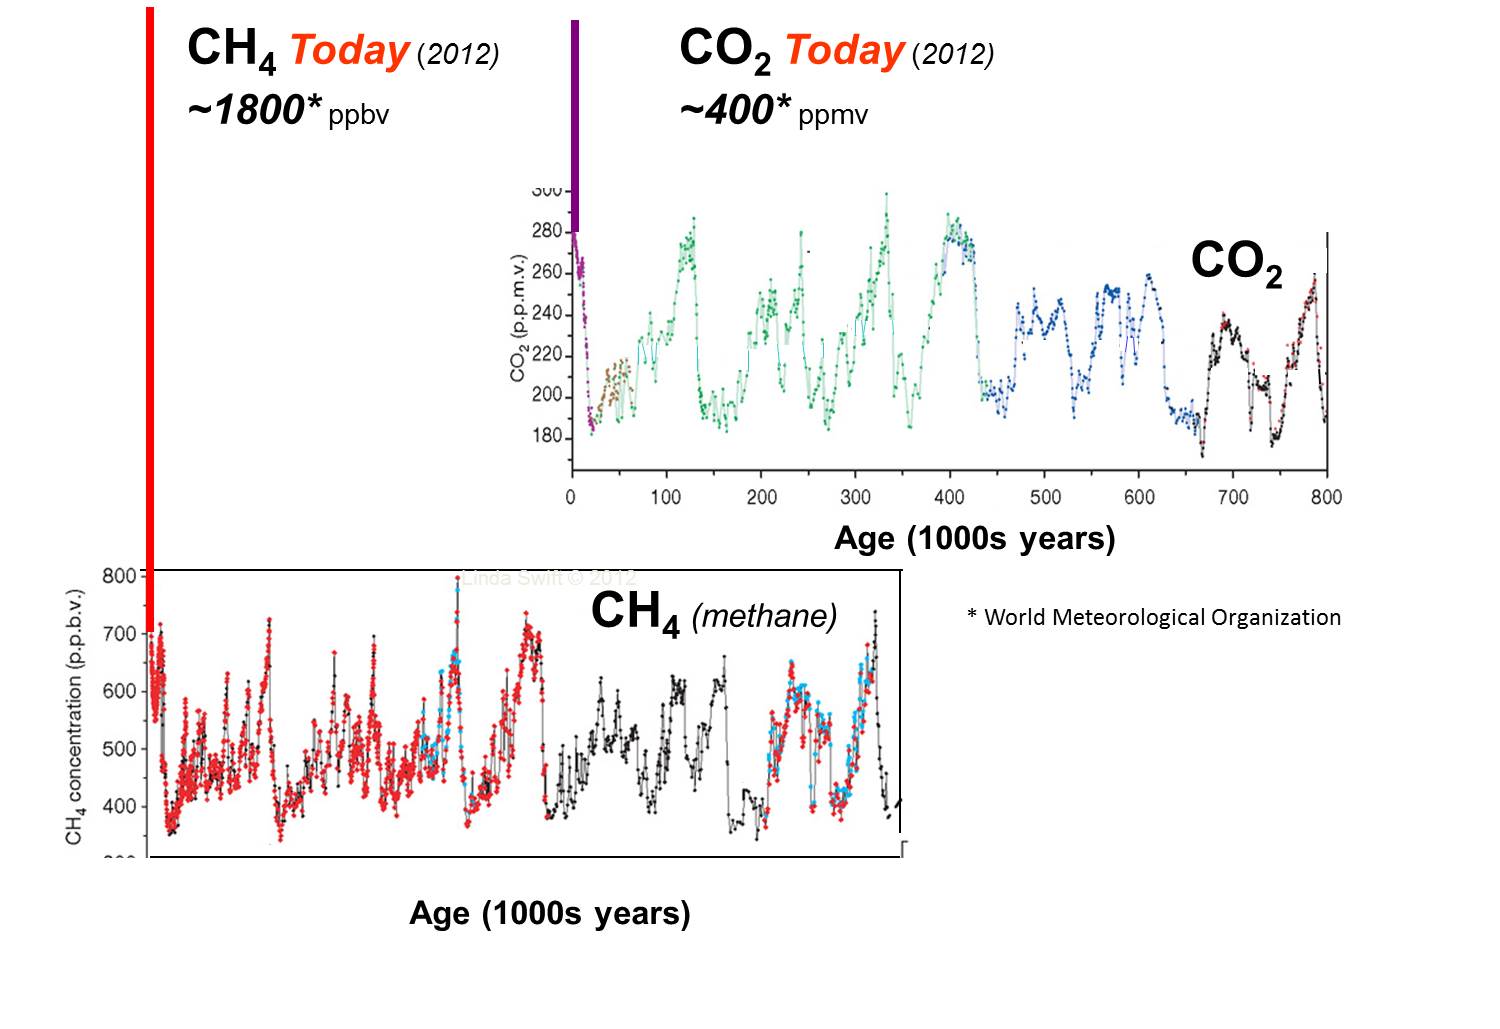 In fact all greenhouse gases are at record levels. The physics of this circumstance tells us that further warming is unavoidable.